
Black Wall Street EDU
Education for Economic Empowerment
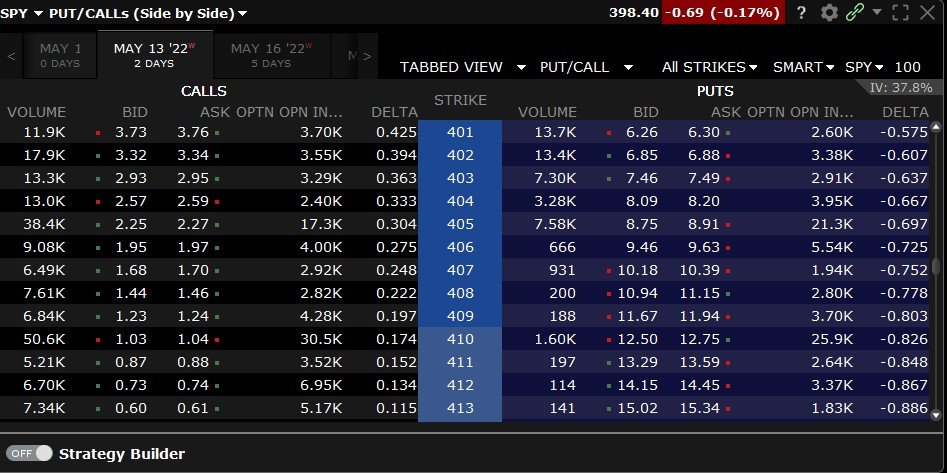
Bid Price:
- The bid price represents the highest price at which a buyer is willing to purchase a particular stock or financial instrument at a given moment.
- It is the price that buyers are willing to pay to acquire shares from sellers in the market.
- When placing a sell order, the bid price is the price at which the seller can expect to sell their shares.
Ask Price:
- The ask price, also known as the offer price or the ask, is the lowest price at which a seller is willing to sell a stock or financial instrument at a given moment.
- It is the price at which sellers are offering to sell their shares to potential buyers in the market.
- When placing a buy order, the ask price is the price at which the buyer will need to pay to acquire shares from sellers.
Difference and Market Spread:
- The difference between the bid and ask price is known as the bid-ask spread or market spread.
- The bid-ask spread represents the cost or the difference between what buyers are willing to pay (bid price) and what sellers are willing to accept (ask price).
- The bid-ask spread is influenced by various factors, including supply and demand dynamics, market volatility, and liquidity.
Market Order and Limit Order:
- A market order is an instruction to buy or sell a stock immediately at the best available market price. When placing a market order to buy, you would typically pay the ask price. When placing a market order to sell, you would typically receive the bid price.
- A limit order is an instruction to buy or sell a stock at a specific price or better. When placing a limit order to buy, you would specify a price lower than the current ask price. When placing a limit order to sell, you would specify a price higher than the current bid price.
Understanding the bid and ask price is essential for investors and traders as it helps them determine the potential costs and returns associated with buying or selling stocks or financial instruments in the market.
- Market Order:
- A market order is an instruction to buy or sell a stock or option at the best available price in the market.
- When placing a market order to buy, you are willing to pay the current ask price.
- When placing a market order to sell, you are willing to accept the current bid price.
- Market orders are typically executed quickly, as they prioritize speed of execution over price.
- Limit Order:
- A limit order is an instruction to buy or sell a stock or option at a specific price or better.
- When placing a limit order to buy, you specify the maximum price you are willing to pay (limit price).
- When placing a limit order to sell, you specify the minimum price you are willing to accept (limit price).
- The order will only be executed if the market reaches or surpasses your specified limit price.
- Limit orders allow you to have more control over the price at which your order is executed.
- Stop Order:
- A stop order, also known as a stop-loss order, is an instruction to buy or sell a stock or option once it reaches a specific price, known as the stop price.
- When placing a stop order to buy, you set a stop price higher than the current market price.
- When placing a stop order to sell, you set a stop price lower than the current market price.
- Once the stop price is reached, the order is converted into a market order and executed at the best available price.
- Good 'til Cancel (GTC):
- A Good 'til Cancel order remains active until it is either executed or manually canceled by the investor.
- This type of order remains in effect for an extended period, usually until the investor decides to cancel it.
- GTC orders are convenient for investors who want to set their desired price levels and have the order remain active until it is filled or canceled.
These are just a few commonly used order types in trading. It's important to familiarize yourself with the specific order types and their functionalities offered by your brokerage platform or trading system. Understanding these order types allows you to execute trades according to your desired price levels, risk tolerance, and trading strategy.
Stocks
To understand options better, it's important to know some basics about stocks. We'll learn about the fundamentals of stocks, which are the important things we need to know about a company before deciding to buy or sell its stocks. Even though we mainly use technical analysis to make our decisions, having a basic understanding of a few fundamentals can be helpful.
Options
Now, options are a little bit different. They are like special agreements or contracts related to stocks. These agreements give people the right to buy or sell stocks at a specific price in the future. It's like having a special ticket that allows you to buy or sell a piece of cake later on.

Technical Analysis
So, in our lessons, we'll learn about stocks, how they relate to options, and some fundamental aspects of stocks. We'll also use technical analysis, which is a way of studying stock price patterns, to make our trading decisions.
When reading a stock summary, there are several key points to pay attention to. Here’s a breakdown of the important elements and their meanings: This is a great way to get a quick glimpse under the hud of a company to see what they’re all about.
A ticker symbol is a unique set of letters representing a particular stock. It helps identify the stock quickly on exchanges and financial platforms.
The stock price is the current market value of one share of the stock. It indicates the price at which buyers and sellers are willing to trade the stock at that moment.
Market capitalization, also known as market cap, is the total value of a company’s outstanding shares of stock. It is calculated by multiplying the stock price by the number of outstanding shares. Market cap provides an estimate of the company’s overall size and worth.
Dividend yield is the percentage of a stock’s annual dividend payment relative to its stock price. It indicates the return on investment from dividends and can be useful for income-oriented investors.
The P/E ratio is a valuation metric that compares a company’s stock price to its earnings per share (EPS). It helps investors understand how much they are paying for each dollar of earnings generated by the company.
EPS is a company’s profit divided by its total outstanding shares. It reflects the portion of the company’s earnings attributable to each share of stock. Higher EPS generally indicates better profitability.
Volume refers to the number of shares traded during a specific time period, such as a day or a week. It provides an indication of the stock’s liquidity and investor interest.
The 52-week high/low represents the highest and lowest prices at which the stock has traded over the past year. It helps investors gauge the stock’s price range and potential volatility.
Beta measures a stock’s sensitivity to market movements. A beta of 1 means the stock moves in line with the overall market, while a beta higher than 1 indicates higher volatility.
The company description provides an overview of the business, its industry, products/services, and key operations. It helps investors understand the company’s focus and market presence.
This section highlights important financial metrics such as revenue, net income, and profit margins. It provides insights into the company’s financial performance and stability.
Remember, the specific details and format of a stock summary may vary depending on the source or platform you are using. It’s always essential to refer to reliable and up-to-date sources for accurate information.
In the stock market, sectors refer to broad categories or groups of companies that operate in similar industries or businesses. These sectors are created to classify companies based on the nature of their products, services, or operations. Grouping companies into sectors allows investors, analysts, and market participants to better understand and analyze the performance and trends within specific industries.
Here are some common sectors found in the stock market:
his sector includes companies involved in technology-related products and services, such as software development, computer hardware, semiconductors, telecommunications, and internet services.
This sector encompasses companies in the banking industry, insurance companies, asset management firms, investment banks, and other financial institutions.
This sector consists of companies involved in healthcare services, pharmaceuticals, biotechnology, medical devices, healthcare facilities, and healthcare providers.
This sector includes companies that produce goods and services considered non-essential or discretionary, such as retail, apparel, automobiles, entertainment, travel, and leisure.
This sector comprises companies that produce essential consumer goods, including food and beverages, household products, personal care items, and tobacco products.
This sector includes companies involved in manufacturing, industrial equipment, transportation, construction, engineering, and aerospace.
This sector consists of companies involved in the production, exploration, refining, and distribution of energy resources, including oil, natural gas, and renewable energy.
This sector includes companies that provide essential services such as electricity, natural gas, and water. It typically comprises regulated utility companies.
This sector comprises companies involved in real estate development, ownership, and management, including real estate investment trusts (REITs) and real estate development firms.
This sector includes companies involved in the extraction, production, and processing of raw materials and commodities, such as metals, chemicals, construction materials, and forestry products.
These sectors provide a framework for organizing and analyzing companies within the stock market. Investors often consider sector performance and trends when making investment decisions, as different sectors may exhibit varying levels of growth, profitability, and volatility based on economic conditions, market trends, and industry-specific factors.
By focusing on a sector that aligns with your interests and knowledge, you can make the learning process more enjoyable and engaging. Here are a few reasons why this approach can be beneficial:
Choose a sector you you enjoy trading
When you are passionate about a specific sector, you naturally have a greater interest and motivation to learn about the companies, trends, and developments within that industry. This enthusiasm can fuel your drive to conduct thorough research and stay updated with the latest news and events impacting the sector.
By focusing on a particular sector, you can develop a deeper understanding of the industry dynamics, competitive landscape, regulatory environment, and market trends. This knowledge allows you to make more informed investment decisions and identify potential opportunities or risks specific to that sector.
When you are interested in a sector, conducting research becomes an enjoyable and fulfilling activity rather than a tedious task. You may find yourself naturally exploring company reports, industry publications, news articles, and other sources of information to gain insights into the sector’s performance and the factors driving its growth or challenges.
Choosing to invest in sectors aligned with your personal values and interests allows you to support companies that you believe in and have a positive impact on society. For example, if you are passionate about sustainable energy, you can focus on the renewable energy sector and invest in companies contributing to a greener future.
Developing expertise in a specific sector can give you a competitive advantage over more generalized investors. You can become well-versed in the nuances of the sector, identify emerging trends or disruptive technologies, and recognize opportunities that others may overlook.
However, it’s important to note that while passion is valuable, it should be coupled with thorough research and analysis. Make sure to evaluate the financial health, competitive position, and growth potential of individual companies within your chosen sector. Keep in mind that diversification is also crucial to manage risk effectively, so it’s advisable to spread your investments across multiple sectors rather than concentrating solely on one.
By aligning your trading or investment activities with your passions, you can make the learning process more enjoyable, increase your knowledge, and potentially find greater success in the stock market.
Market capitalization (Market Cap) and outstanding shares are both important measures used in evaluating and understanding the value and size of a publicly traded company. Here’s a brief explanation of the difference between these two concepts:
Let's talk about market Cap vs Oustanding Shares
- Market capitalization refers to the total value of a company’s outstanding shares in the stock market. It is calculated by multiplying the current market price per share by the total number of outstanding shares. Market cap provides an estimation of a company’s overall worth in the eyes of investors.
- Market cap determines the company’s relative size in the market. It categorizes companies into different market cap categories such as large-cap, mid-cap, or small-cap.
- Market cap is influenced by the share price, as well as the number of outstanding shares. A higher share price or a larger number of outstanding shares will contribute to a higher market cap.
- Outstanding shares, also known as issued shares or shares outstanding, represent the total number of shares that have been issued by a company and are held by its shareholders, including institutional investors and individual investors.
- Outstanding shares include shares held by insiders, institutional investors, and individual investors. They represent ownership stakes in the company.
- Outstanding shares can change over time due to factors such as new share issuances (e.g., through initial public offerings or secondary offerings) or share buybacks by the company.
In summary, market capitalization reflects the total value of a company in the stock market, calculated by multiplying the current market price per share by the total number of outstanding shares. Outstanding shares, on the other hand, represent the total number of shares issued by the company and held by its shareholders. Both measures are important in evaluating a company’s size, value, and investor interest, but they represent different aspects of a company’s financial structure and market position.
By aligning your trading or investment activities with your passions, you can make the learning process more enjoyable, increase your knowledge, and potentially find greater success in the stock market.
Let's talk about Moving Averages
A moving average is a commonly used technical analysis tool in the stock market and other financial markets. It is a calculation that helps smooth out price data over a specified period of time, providing a clearer picture of the overall trend.
To calculate a moving average, you take the average price of a security (such as a stock) over a specific time period and continuously update it as new data becomes available. The time period can vary based on individual preferences and trading strategies, ranging from short-term averages (e.g., 10-day or 20-day moving averages) to long-term averages (e.g., 50-day or 200-day moving averages).
Moving averages are often plotted on price charts as lines, helping traders identify trends and potential support or resistance levels. They provide a smoother line compared to the daily price fluctuations, making it easier to spot the underlying trend.
The two commonly used types of moving averages are the simple moving average (SMA) and the exponential moving average (EMA). The SMA calculates the average price by summing up the closing prices over the chosen time period and dividing it by the number of periods. The EMA, on the other hand, assigns greater weight to recent prices, making it more responsive to price changes.
Moving averages are used in various ways by traders and investors. They can help identify the direction of the trend (upward, downward, or sideways), determine potential entry or exit points, and provide indications of support and resistance levels. By analyzing the crossovers and relationships between different moving averages, traders can generate trading signals and make informed decisions.
It’s important to note that moving averages are lagging indicators, which means they are based on past price data. They are most effective in trending markets and may not be as reliable in choppy or volatile market conditions. Traders often use moving averages in combination with other technical indicators and analysis techniques to gain a more comprehensive understanding of market trends and potential trading opportunities.